
Results
Explore the reports and publications
Trend Analyses
Spring
Migration Trends – Spring 2023 and Trend Analysis Charts – Spring 2023 provide the results of trend analysis on species monitored at Inglewood Bird Sanctuary through 2023. In Trend Analysis Charts – Spring 2023 the y-axis shows the annual abundance index estimate in captures per day. This only pertains to the 95%-migration window, so it should only be used to compare abundances between species within their respective migration windows. To compare overall abundances between species one should refer to the season totals.
2002-2023 (all-time)
American Robin, Swainson’s Thrush and Yellow Warbler continue to have significant negative all-time trends.
2014-2023 (10-year)
Lincoln’s Sparrow continues to have a significant positive 10-year trend.
Fall
Migration Trends – Fall 2023 and Trend Analysis Charts – Fall 2023 provide the results of trend analysis on species monitored at Inglewood Bird Sanctuary through 2023. In Trend Analysis Charts – Fall 2023 the y-axis shows the annual abundance index estimate in captures per day. This only pertains to the 95%-migration window, so it should only be used to compare abundances between species within their respective migration windows. To compare overall abundances between species one should refer to the season totals.
1995-2023 (all-time)
Orange-crowned Warbler, Wilson’s Warbler, White-crowned Sparrow, White-throated Sparrow and Baltimore Oriole continue to show significant negative trends. American Robin, MacGillivray’s Warbler and American Tree Sparrow show nearly significant negative trends.
2014-2023 (10-year)
Only Wilson’s Warbler shows a significant negative 10-year trends although Least Flycatcher and Tennessee Warbler show nearly significant negative 10-year trends.
Overall, the data suggests declines for most species both spring and fall. Interpreting the relative contribution to these declines of real population change versus habitat change is difficult. The catastrophic flood of 2013 and the destructive heavy wet snowfall of fall 2014 profoundly changed Inglewood Bird Observatory. Restoration is occurring but slowly.
Methodology
Trend analysis is based on total captures from 1995-2022 for fall migration and 2002-2022 for spring migration and was performed by contract biostatistician Mathias Fenton. In addition to trend analyses since inception Mathias has calculated trends over the last 10 years a time period frequently used by conservation regulators and managers.
95%-migration windows were determined for each season (spring/fall) based on all new capture records for the respective species. A 95%-migration window describes the period in a specific season within which 95% of all individuals of a species were caught historically. Trend analyses were restricted to these windows This technique reduces the amount of days with zero captures and avoids disproportional impact of unusually early or late captures on the analyses.
Daily captures were first standardized with respect to daily net hours to account for variation in net opening times. Net hour totals only included focal nets, which were defined as nets with at least one historic capture. After standardization the captures were normalized to represent the expected number of captures for each day under the condition that all focal nets were open for exactly six hours. For days where all focal nets remained closed, no capture data was provided to the subsequent model to reduce false negatives.
Normalized captures from all years were used in a single hierarchical model that modelled the daily captures as a function of year, day, and day2. The model was implemented in R using the library for Integrated Nested Laplace Approximation (INLA). The observation error distribution was specified as ‘negative binomial’ and auto-regressive process error terms were included for day and year. To obtain mean estimates for the trend associated with year as well as for the average daily abundance within a season (annual abundance index), the posterior probability distributions produced by the model were sampled 10,000 times. Confidence limits and significance levels for each estimate were calculated based on the distribution of samples. Because the model provides linear trend estimates for the logarithm of captures, percent population changes per year were obtained through back-transformation.
Trend Analysis Charts – Fall 2023
Migration Trends – Fall 2023
Trend Analysis Charts – Spring 2023
Migration Trends – Spring 2023
Origins of IBO Migrants
A major goal of the CMMN including IBO is to try and identify the geographic origin of the Neotropical Migrants we monitor to facilitate focusing conservation efforts when needed. A tool we have embraced at IBO is using d2H stable isotope analyses of feather material to narrow down the latitude where our migrants generated those feathers (see Hobson).
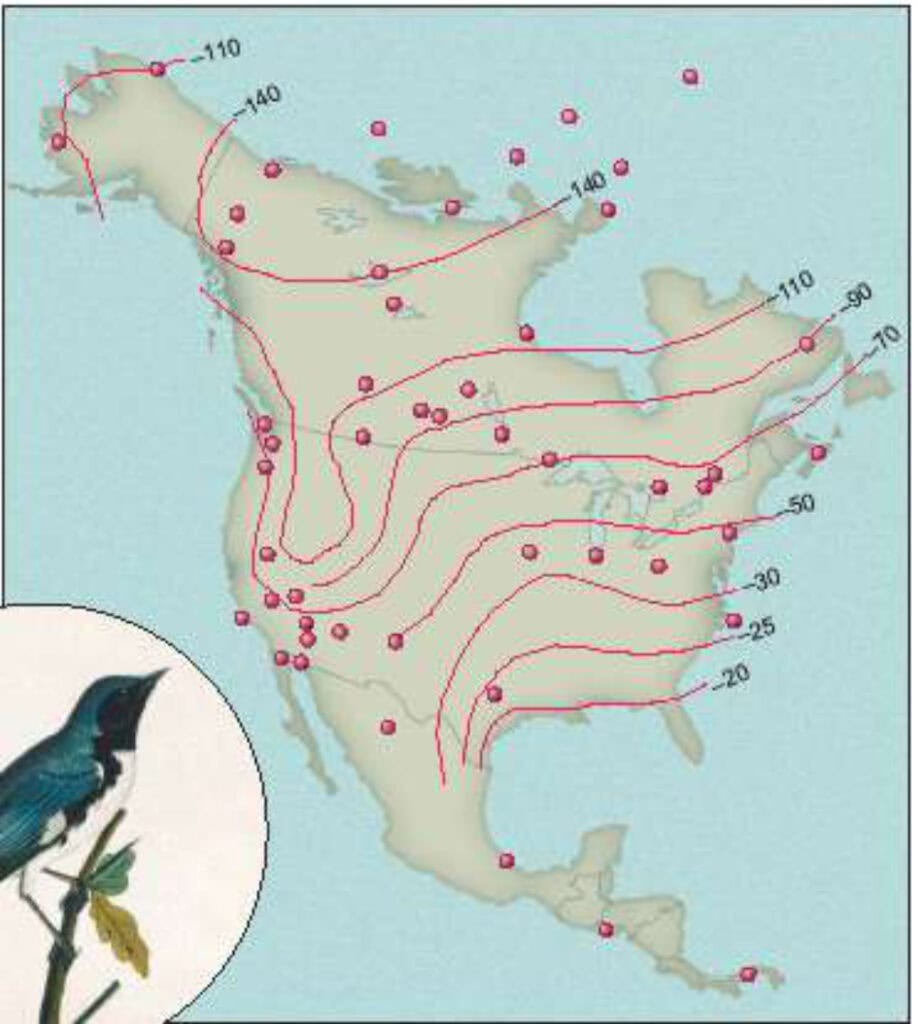
This figure illustrates how d2H varies latitudinally in North America getting more negative from south to north. Note that IBO, the yellow circle, in SW Alberta is located in an area that
appears less predictable because of the adjacent Rocky Mountains.
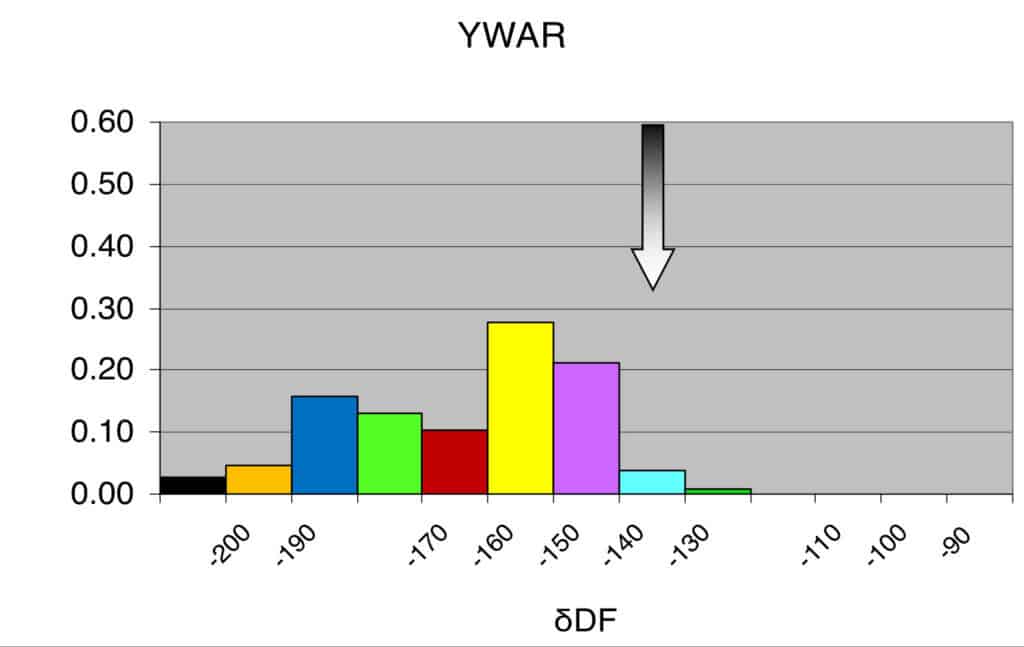
This a typical example of the results we obtained from our d2H analyses (see Origins). Keep in
mind that more negative values suggest a more northerly origin. Also note that the arrow is
pointing to the reference value at IBO. All of our monitored species showed variations on this
profile suggesting a northerly origin. Except for one. Wilson’s Warbler.
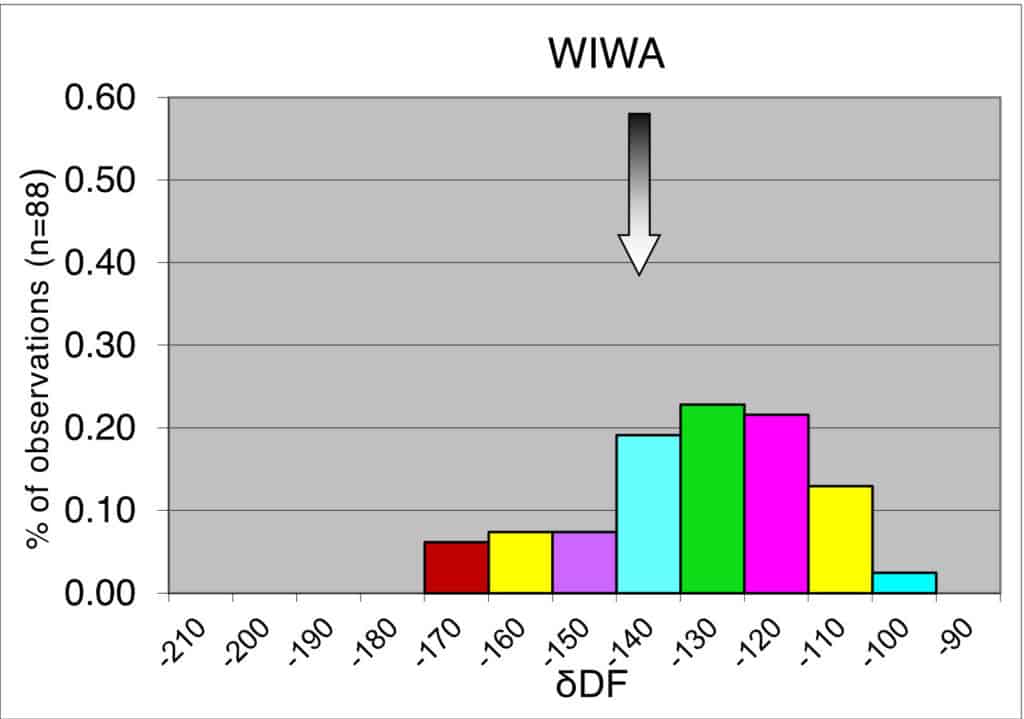
However high-resolution gene c analysis (Ruegg KC et al. (2014) Mapping migration in a songbird using high-resolution gene c markers Mol Ecol 23:5726-5739 doi:10.1111/mec.12977) indicated that the majority (96.3%) of birds migrating through our study site in 2015 were derived from the western boreal population group (n = 155) (see IBOC presentation). The remaining birds were from the eastern boreal (n=3), Pacific Northwest (n=1) or the Rocky Mountain (n=2) populations.
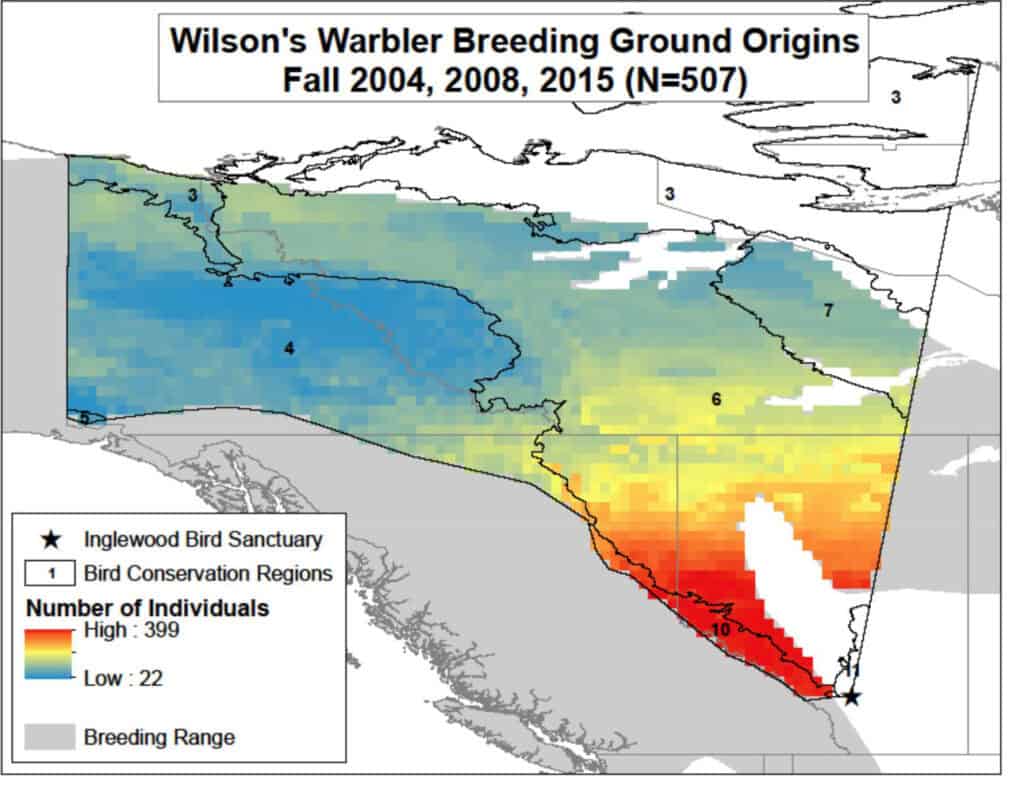
All Wilson’s Warblers determined not from the western boreal population were juveniles.
Below is the probability map of the origin of Wilson’s Warblers migrating through IBO in fall. Red is high probability, blue is low. Known Wilson’s Warbler range, the continental divide and the likely direction of migration from banding recoveries also informed this map. We are not sure why the d2H values appear anomalous but perhaps the adjacent mountains to the west have something to do with it. Western Boreal Wilson’s Warblers breeding range does include the Rocky Mountains west of IBO.
Annual Technical Reports
Download the ATRs (Annual Technical Reports).
Publications
We publish in peer-reviewed journals based on our research.
Smith, Cyndi M. and Douglas M. Collister. 2025. Wing length and mass ranges of resident birds at two sites in Costa Rica. North American Bird Bander 50:11-36.
Dunn, E., R. Boardman, P. Campsall, D. Collister, B. Drolet, P-A Dumas, D. Either, M. Gahbauer, S. Mackenzie, P. Sinclair, and C. Smith. 2021. The Canadian Migration Monitoring Network – Réseau canadien de surveillance des migrations: Researching Canada’s Landbirds for Twenty Years. Vingt ans de recherche sur les oiseaux terrestres au Canada. CMMN-RCSM Scientific Technical Report #3. Birds Canada, Port Rowan, Ontario. 29p.
Dunn, Erica H., D. Collister, T. L. Crewe, B. Drolet, D. Okines and J. McCracken. 2018. Monitoring population trends of boreal forest songbirds using migration counts. Poster presented at International Ornithological Congress 18-25 August, Vancouver, BC.
Kardynal, Kevin J, Douglas M. Collister, and Keith A. Hobson. 2018. Origins of Wilson�s Warblers migrating through southwest Canada: Adding value to banding data by using stable isotopes and genetic markers. Anim. Migr. 2018: 5: 17-28.
Gahbauer, M.A., C.M. Smith, M. Grosselet and G. J. Ruiz Michael. 2016. Influence of Audio Lures on Capture Rates of Passerines During Spring Migration in Veracruz, Mexico. NABB 41(4):170-183
Priestley, L.T., C Priestley, D.M. Collister, H. Fisher, G.Holroyd, R. Krikun, and M. Blom. 2016. Evidence of Partial Migration, Encounters of Northern Saw-whet Owls from Banding Stations in Alberta and Saskatchewan. Poster presented at the Alberta Chapter of the Wildlife Society AGM 4-6 March in Drumheller.
Hobson, K. A., S. L. Van Wilgenburg, E. H. Dunn, D. J. T. Hussell, P. D. Taylor and D. M. Collister. 2015. Predicting origins of passerines migrating through Canadian migration monitoring stations using stable-hydrogen isotope analyses of feathers: a new tool for bird conservation. Avian Conservation and Ecology 10 (1): 3.
Wilson, S., D.M. Collister and A.G. Wilson. 2011. Community composition and annual survival of lowland tropical forest birds on the Osa Peninsula, Costa Rica. Ornitologia Neotropical 22:421-436.
Priestley, L., C. Priestley, D.M. Collister, D. Zazelenchuk and M. Hanneman. 2010. Encounters of Northern Saw-whet Owls (Aegolius Acadicus) from banding stations in Alberta and Saskatchewan, Canada. J. Raptor Res. 44(4):300-310.
Smith, C.M., D.R. Kaschube, and D. Collister. 2009. Monitoring Avian Productivity and Survivorship (MAPS) at Inglewood Bird Sanctuary, Calgary, Alberta, 1992-2008. Unpublished technical report. Calgary Bird Banding Society, Calgary, AB. 29 pp.
The Canadian Migration Monitoring Network – Roseau canadien de surveillance des migrations 2008. Ten-Year Report on Monitoring Landbird Population Change
Wilson, S., K. A. Hobson, D. M. Collister, and A. G. Wilson. 2008. Breeding Destinations and Spring Migration Patterns of Swainson’s Thrush (Catharus Ustulatus) at a Costa Rican Stopover Site. The Auk. 125(1):95-104
Wilson, S., K. A. Hobson, D. M. Collister, and A.G. Wilson. 2008. Spring migratory stopover of Swainson’s thrush along the Pacific coast of southwest Costa Rica. Wilson Journal of Ornithology.120(1): 74-84
Dunn, E.H. 2002. A Cross-Canada Comparison Of Mass Change In Birds During Migration Stopover. Wilson Bulletin. 114(3): 368-379
Preliminary Results and Analyses
CBBS compiles preliminary reports of the current year’s results in the context of results to date as soon as possible after completion of each year’s replicate. These reports are briefer than our Annual Technical Reports but serve as an important source of results pending completion of ATRs (preparation of which we are significantly behind on).
Also included here are summaries of completed projects from years for which a CBBS ATR is not available yet as well as summaries of stopover site fidelity at IBO and stable isotope analysis of feather samples from IBO.
Preliminary results of 2025 Inglewood Bird Sanctuary Spring Migration Monitoring
Preliminary results of 2025 Inglewood Bird Sanctuary Fall Migration Monitoring
Preliminary results of 2023 Belize Spring Migration Monitoring
Preliminary results of 2016 Cypress Hills Interprovincial Park Spring Migration Monitoring
Preliminary results of 2016 Cypress Hills Interprovincial Park Fall Migration Monitoring
Preliminary results of 2015 Cypress Hills Interprovincial Park Northern Saw-whet Owl Migration Monitoring
Preliminary results of 2014 Tillebrook Provincial Park Spring Migration Monitoring
Preliminary results of 2014 Tillebrook Provincial Park Fall Migration Monitoring
Interpretation of Inglewood Bird Sanctuary MM isotope samples
Stopover site fidelity at Inglewood Bird Sanctuary and other CMMN stations